OEE Formula & Calculation Guide
Master the OEE framework: understand availability, performance, quality. Calculate your baseline, benchmark against industry standards, identify hidden equipment losses. Step-by-step guide for manufacturing leaders.
Overall Equipment Effectiveness (OEE) is the most important metric in manufacturing. It tells you the truth about your production lines that revenue reports hide: how much productive capacity you’re wasting.
- September 2026
- 12 minute read
- Manufacturing KPIs · Equipment Effectiveness · Production Analytics
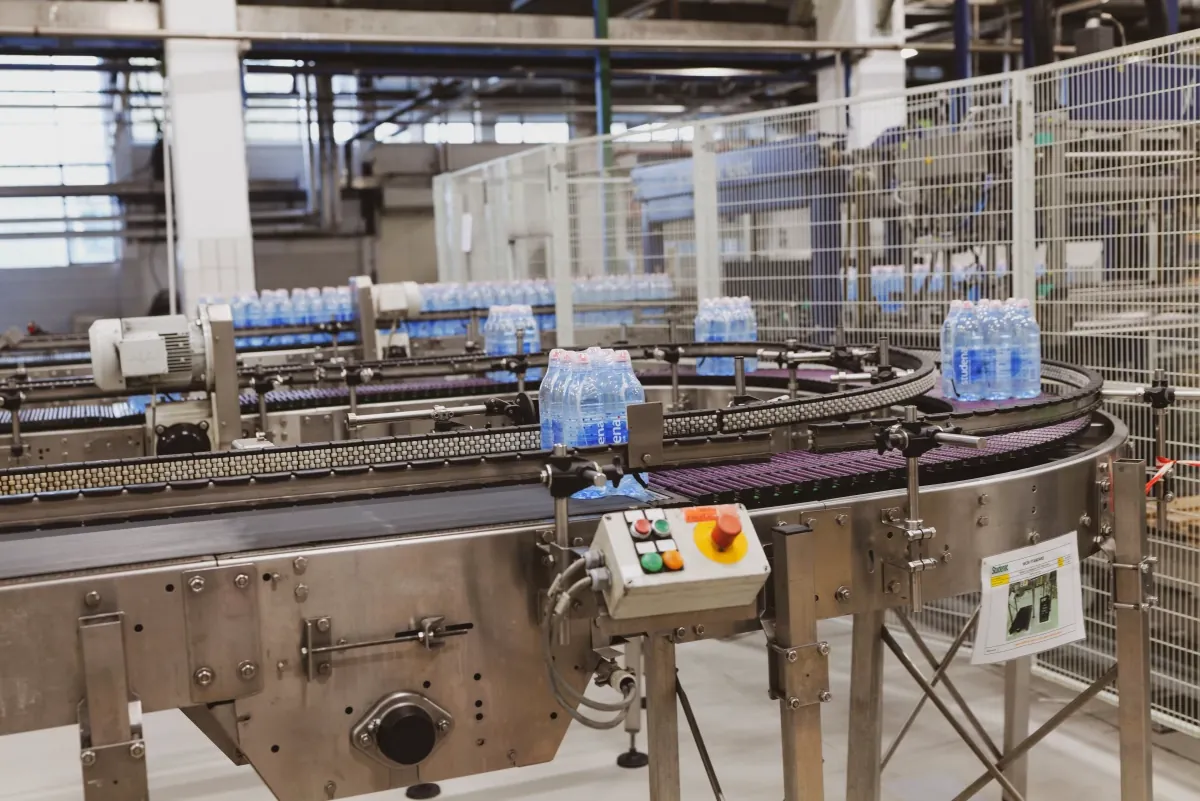
A manufacturer running at 60% OEE is operating with 40% invisible waste—equipment stops, slow cycles, quality rejects— that silently erodes profitability. If that 60% line runs 3 shifts producing 1,500 units/day, a 5-point OEE improvement (60% 65%) unlocks 75 additional units daily = €40k–€150k annual revenue with zero capital investment beyond optimization.
This guide teaches you to measure OEE accurately, benchmark your performance, and identify which equipment losses offer the biggest ROI when addressed.
What Is OEE? The Core Definition
Overall Equipment Effectiveness (OEE) measures how effectively your manufacturing equipment performs across three dimensions:
OEE Calculation Formula
OEE = Availability ×
Performance × Quality
Availability = Planned Production Time vs. Actual Run Time
Performance = Theoretical Speed vs. Actual Speed
Quality = Good Units vs. Total Units Produced
The formula multiplies three independent factors, which means each must be high for OEE to be excellent. If any factor is weak, OEE drops dramatically.
Quick Example:
If your line has: 85% availability, 88% performance, 92% quality
Then OEE = 0.85 × 0.88 × 0.92 = 68.6%
The Three Pillars of OEE Explained
Pillar 1: Availability (Planned Run Time)
What it measures: What percentage of planned production time is your equipment actually running?
Formula:
Availability Calculation
- 01
Planned Production Time
Example: 480 min/day
- 02
Unplanned Downtime
Example: 72 min (equipment failure)
- 03
Changeover Time
Example: 48 min (product switch)
- 04
Run Time = Planned − Downtime − Changeovers
360 minutes
- 05
Availability = Run Time / Planned Time
360 ÷ 480 = 75%
What loses availability:
- Unplanned equipment failures (pump seals, motor bearings, hydraulic leaks)
- Changeover delays (switching product A to product B takes 45 min instead of 20 min)
- Waiting for materials (raw materials not ready when equipment restarts)
- Scheduled maintenance (included in planned time, so shouldn’t be counted as loss)
- Setup errors (wrong part loaded, wrong recipe programmed)
Availability Insight:
Most manufacturers lose 15-25% of planned time to downtime. World-class target: 90%+. Every 5% availability improvement = 24 extra operating minutes per shift.
Pillar 2: Performance (Cycle Time vs. Theoretical Speed)
What it measures: How fast does your equipment run vs. its theoretical maximum speed?
Formula:
Performance Calculation
- 01
Theoretical Cycle Time
Example: 6 sec per unit
- 02
Actual Cycle Time (avg)
Example: 8 sec per unit
- 03
Theoretical Output (360 min)
3,600 units ÷ 6 sec
- 04
Actual Output (360 min)
2,700 units ÷ 8 sec
- 05
Performance = Actual Output / Theoretical
2,700 ÷ 3,600 = 75%
What reduces performance:
- Micro-stops (1-2 second jams, misfeeds that auto-clear)
- Reduced speed operation (running slower to avoid quality defects)
- Operator hesitation (waiting for parts, checking quality manually)
- Sensor false positives (equipment stops because sensor triggers incorrectly)
- Lack of operator skill (new operators run 20-30% slower)
Performance Insight:
Micro-stops (visible or invisible) account for most performance losses. Many manufacturers don’t measure them because they’re short-duration (<5 seconds). But 300 micro-stops × 3 seconds = 15 minutes of hidden waste per shift.
Pillar 3: Quality (Good Output vs. Total Output)
What it measures: What percentage of units produced are defect-free on first attempt?
Formula:
Quality Calculation
- 01
Total Units Produced
Example: 2,700 units
- 02
Defective Units
Example: 405 units (15%)
- 03
Good Units
2,700 − 405 = 2,295
- 04
Quality = Good Units / Total Units
2,295 ÷ 2,700 = 85%
What reduces quality:
- Dimensional errors (parts out of spec: ±0.1mm tolerance)
- Surface defects (scratches, dents, discoloration)
- Missing components (assembly missing a screw, cable, seal)
- Contamination (dust, rust, foreign material in/on product)
- Performance failures (electronics don’t power on, seals don’t hold pressure)
Quality Insight:
Quality defects are expensive: rework cost 2-3x production cost. A 15% defect rate means 1 out of 7 units must be reworked. That’s not just waste—it’s cost-multiplied waste.
Worked Example: Complete OEE Calculation
Let’s calculate OEE for a plastic injection molding line over 1 day:
Injection Molding Line: Daily OEE Assessment
Equipment: Plastic injection molding machine, 3 shifts (480 min planned per shift) | Product: Automotive connectors (target: 6 sec cycle time)
- 01
Shift Duration
480 minutes
- 02
Scheduled Maintenance
30 min (included in planned)
- 03
Unplanned Failure (pump seal)
45 min
- 04
Changeover Time
60 min (3 product switches)
- 05
Actual Run Time
345 min (480 − 45 − 60 − 30)
- 06
Theoretical Output (6 sec/unit)
3,480 units (345 min × 60 sec ÷ 6)
- 07
Actual Output (measured)
2,484 units
- 08
Defective Units (visual inspection)
273 units (11%)
Calculation Breakdown:
OEE Calculation: Step-by-Step
- 01
Step 1: Calculate Availability
Availability = 345 min (run time) ÷ 480 min (planned) = 71.9%
- 02
Step 2: Calculate Performance
Performance = 2,484 (actual) ÷ 3,480 (theoretical) = 71.4%
- 03
Step 3: Calculate Quality
Quality = (2,484 − 273) ÷ 2,484 = 2,211 ÷ 2,484 = 89.0%
- 04
Step 4: Calculate OEE
OEE = 0.719 × 0.714 × 0.890 = 45.6% Below average. Target: 80%+ (world-class: 85%+)
OEE Benchmark Standards & What They Mean
| OEE Score | Performance Level | Typical Industry | What It Means |
|---|---|---|---|
| 85%+ | World-Class | Automotive, Pharma, Semiconductors | Equipment runs as designed. Minimal waste. Continuous improvement culture. |
| 80-85% | Excellent | Advanced Manufacturing | Strong performance. Few major losses. Frequent preventive maintenance. |
| 75-80% | Good | European Manufacturing | Acceptable but room for improvement. Reactive maintenance common. |
| 60-75% | Fair (Below Average) | Most SMB Manufacturers | Significant hidden waste. Frequent equipment failures or quality issues. |
| <60% | Poor | Legacy Equipment / No Standards | Critical losses in all three areas. Equipment unreliable. Quality inconsistent. |
Industry Benchmark Context:
Global average OEE: 60-65% | Best-in-class target: 85%+ | Lean manufacturing target: 80%+
Where Most Manufacturers Lose OEE
Based on data from 500+ manufacturing sites, here’s the typical breakdown of OEE loss:
| Loss Category | Availability Loss | Performance Loss | Quality Loss | Avg. Impact on OEE |
|---|---|---|---|---|
| Unplanned Equipment Failures | 15% | — | — | −15% OEE |
| Slow Changeovers | 8% | — | — | −8% OEE |
| Micro-Stops & Hesitations | — | 12% | — | −12% OEE |
| Operator Variability | — | 5% | — | −5% OEE |
| Quality Defects (No Inspection) | — | — | 12% | −12% OEE |
| Hidden Quality Issues (Undetected) | — | — | 8% | −8% OEE |
| Total Typical Loss | 23% | 17% | 20% | 60% OEE (40% waste) |
How to Improve OEE: The Prioritization Framework
Not all losses cost the same to fix. Use this framework to identify which improvements offer the best ROI:
Priority 1: Quality Improvements (Highest ROI)
Why: Defects compound: bad unit made = rework cost 2-3x production cost.
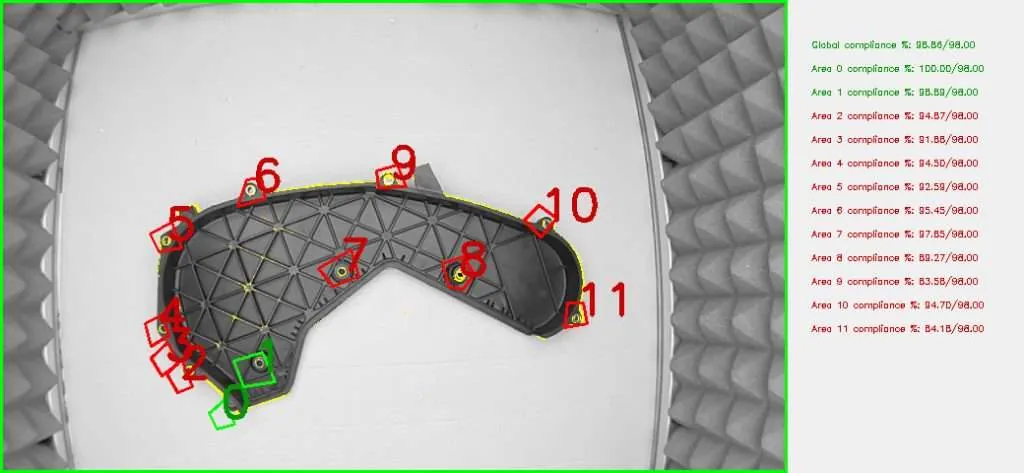
Action: Deploy real-time quality inspection. Even 1% quality improvement = significant cost savings.
Timeline: 1-3 months to deploy. Results visible immediately.
Priority 2: Availability (Predictive Maintenance)
Why: Unplanned failures are expensive and disrupt scheduling.
Action: Monitor equipment sensors, detect degradation early, schedule maintenance before failure.
Timeline: 2-4 months to implement. ROI in 6-8 weeks.
Priority 3: Performance (Micro-Stops & Optimization)
Why: Micro-stops are invisible but cumulative. Hardest to detect without AI vision.
Action: Install cameras + AI to count stoppages, identify root cause, optimize equipment settings.
Timeline: 3-6 months. Requires learning curve.
OEE Measurement: Tools & Methods
Manual Tracking (Low Cost, Low Accuracy)
- Operator logs downtime on paper or spreadsheet
- Periodic quality audits (sample 50-100 units)
- Visual estimation of run speed
- Accuracy: ±5-10% (human error high)
- Cost: Operator time only
SCADA/PLC Integration (Medium Cost, Medium Accuracy)
- Equipment logs production counts, stops, cycle times automatically
- Integrates with MES (Manufacturing Execution System)
- Real-time OEE dashboard
- Accuracy: ±1-2% (equipment-based)
- Cost: €10k-50k one-time + €2k-5k annual maintenance
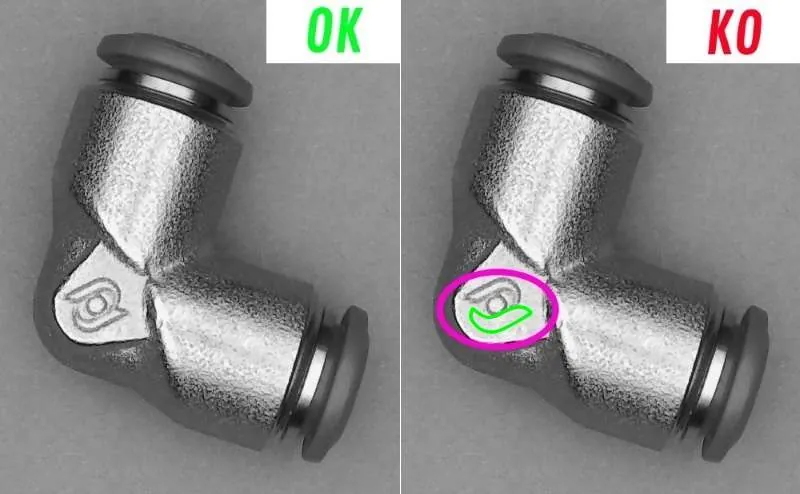
AI Vision + Predictive Analytics (High Cost, Highest Accuracy)
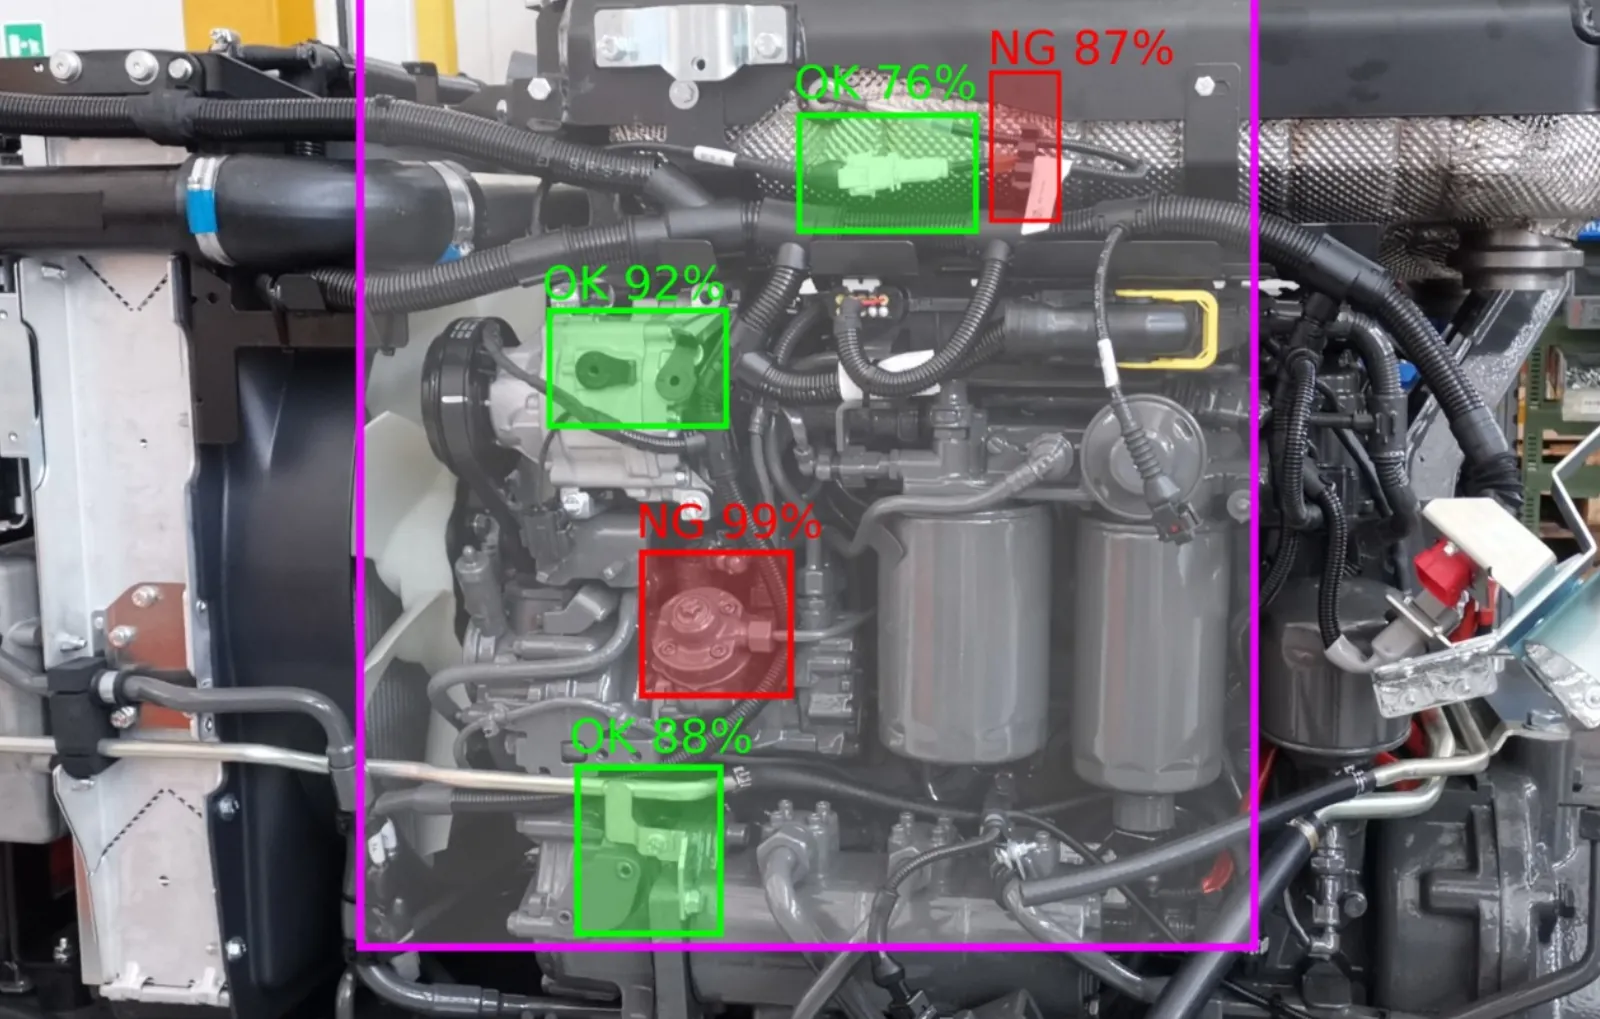
- Computer vision monitors equipment state, defects, operator actions in real-time
- Predicts equipment failures 24-48 hours in advance
- Automatic quality grading (100% inline inspection)
- Accuracy: 99.5%+ (AI-validated)
- Cost: €30k-80k one-time + €5k-10k annual SaaS
FAQs About OEE
Q: Should I target 100% OEE?
A: No. 100% is impossible in real manufacturing. Realistic targets: 85%+ (world-class), 80%+ (good), 75%+ (competitive). Even Tesla, the efficiency benchmark, runs at 82-85% OEE. Anything above 85% is exceptional.
Q: What’s the difference between OEE and utilization?
A: Utilization = % of time equipment is available (availability only). OEE = % of time equipment produces good output (availability × performance × quality). OEE is the more accurate metric because utilization alone masks quality and speed losses.
Q: How often should I measure OEE?
A: Daily minimum (track trends). Weekly rolling average (smooth out one-off events). Monthly/quarterly (identify seasonal patterns). If possible, measure in real-time via MES/AI system.
Q: If I improve OEE by 5 points, how much revenue does that unlock?
A: Formula: (OEE Improvement × Available Equipment Hours × Output/Hour × Gross Margin) = Annual Benefit. Example: 5% improvement on 1,500 units/day line × €30 margin = €40k-€75k/year in additional revenue with minimal capex.
Q: What’s more important: availability, performance, or quality?
A: All three are important, but quality loss is most expensive because rework cost 2-3x production cost. Availability loss is most disruptive because it delays entire schedules. Performance loss is most hidden because micro-stops are invisible. Address all three, but start with quality.
Know Your OEE, Own Your Losses
Calculate your baseline OEE today. Identify which losses cost you most (availability, performance, quality). Get a free OEE assessment showing exactly where AI vision can unlock hidden capacity.
Calculate My OEE Baseline See OEE Improvement Example
Related Reading:
Looking to improve your calculated OEE? Read “Maximize OEE with Computer Vision” — a practical guide to implementing AI vision for real-time availability, performance, and quality monitoring.
Test it on your line. Before you spend a euro.
Send us 20 defective parts or high-res photos. We train a model on your parts and show you detection rate, false positives and cycle time before you sign anything.
- parts or photos
- 20
- parts or photos
- days to results
- 5-7
- days to results
- no commitment
- €0
- no commitment
Trusted on production lines at






Related applications
-
 Article
Data Intelligence, Computer Vision & Boosting OEE.
Achieving maximum efficiency, quality, and compliance in manufacturing is no longer optional. The integration of data intelligence, computer vision, and autonomous AI is…
Read -
 Solution
AI Quality Control in 2026: Choosing the Right Solution for Your Factory
Manual inspection vs. industrial cameras vs. smartphone-based solutions. A realistic guide to what works, what costs what, and where each technology fits.
Read - Solution
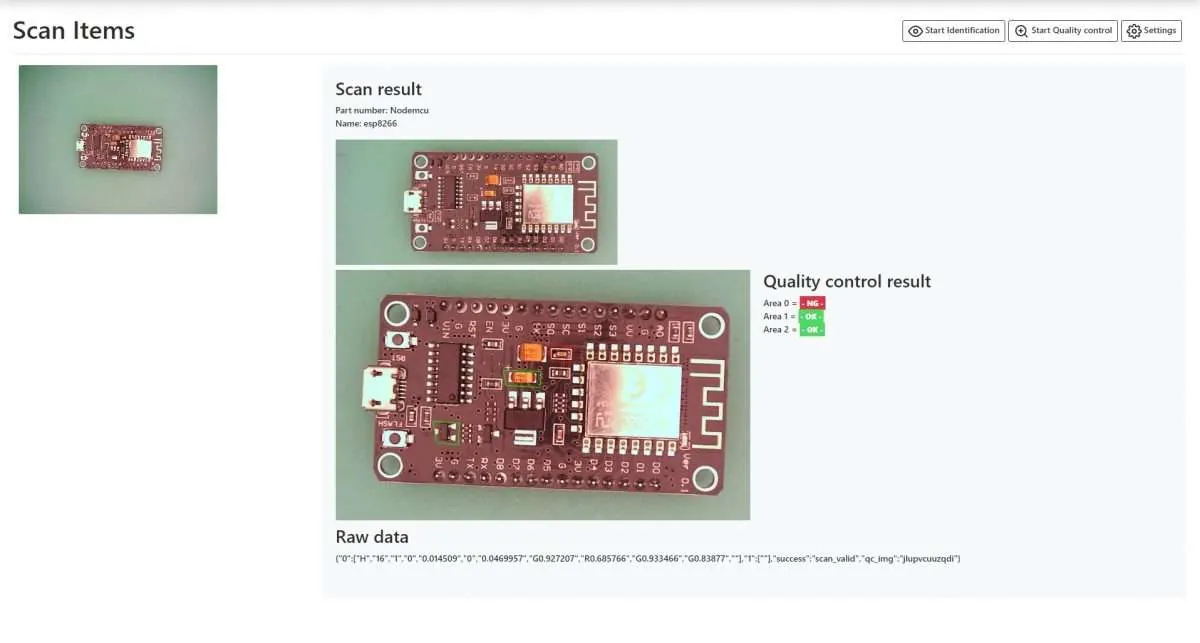
Maximize OEE with Computer Vision
Boost equipment availability, performance, and quality automatically. Real-time defect detection, predictive maintenance, 80%+ OEE in 12 weeks.
Read